
A Quantitative Look at the Supreme Court of Canada
Lawyers are trained to do close and careful reading of cases. We are experts in textual analysis of individual decisions, and we can spend hours arguing over what individual paragraphs in Supreme Court of Canada decisions mean. Yet while individual decisions are important, so are the aggregate trends. Quantitative data can reveal important information that lawyers can use to engage in more effective advocacy and better inform our clients as to what to expect.
For that reason, those who practice at the Supreme Court of Canada will be very interested in its 2019 Year in Review. Released on April 30, 2020, the Year in Review contains very important aggregate data on the Supreme Court’s leave applications and appeals.
The aggregate data presented in the Year in Review has some limitations: for example, while the report provides a variety of metrics (e.g. percentage of leave applications in which leave is granted), those metrics are not provided for subsets of cases (e.g. percentage of leave applications in criminal cases in which leave is granted). A more fulsome analysis of the Supreme Court’s practice would require the underlying granular data on which the Year in Review is based. That being said, the report contains quite a bit of helpful data, and with some additional assumptions, some very interesting inferences can be made. (I note below at a handful of spots how the granular data could have allowed for better insights.)
In the spirit of the listicle era, here are the top 10 take-aways from the 2019 Year in Review:
1. It’s hard to get leave—In 2019, the Supreme Court of Canada granted leave to appeal in only 36 cases, meaning that just 7% of leave applications were successful.
2. It’s gotten harder to get leave—The number of cases in which the Supreme Court is granting leave is going down, both in raw numbers and by the percentage of successful leave applications. The 2019 numbers are the lowest numbers in the last 10 years: over the prior nine years, the number of successful leave applications varied between 41 and 69, and the percentage of cases in which leave was granted has varied between 8% and 13%.
3. But the number of appeals isn’t dropping—The decline in the number of successful leave applications hasn’t actually meant fewer appeals. Rather, an increase in the number of appeals as of right has actually meant that the total number of appeals heard in 2019 was the highest over the last five years. (The 24 appeals heard as of right in 2019 represents the highest number of appeals as of right over the last ten years.)
Taking a slightly longer perspective, there has been a drop in the number of appeals that the Court has heard annually. From 2011 through 2014, the Supreme Court consistently heard 70 or more cases every year, with a peak of 80 cases in 2014. Substantially more successful leave applications drove those higher numbers.
4. Your chances of getting leave vary by subject matter—It’s well-known to practitioners that not all leave applications are created equal: cases involving certain subject-matters are more likely to be viewed by the Court as raising issues of national importance that justify the granting of leave. Unfortunately, while the Year in Review contains information on the areas of law of different leave applications, it does not contain statistics on the areas of law of different successful leave applications. However, a rough sense of how easy it is to get leave in different areas of law can be determined by relating the numbers of appeals heard in 2019 by subject matter to the number of leave applications filed in 2019 pertaining to that topic. This analysis is imperfect, because the cases being heard in 2019 aren’t necessarily the result of leave applications made in 2019 and vice versa. However, assuming that the proportions stay roughly consistent year-over-year, this still provides some insight.
Recognizing those limitations, this rough and ready analysis suggests that the easiest area to get leave is in non-Charter constitutional cases: in 2019, there were 21 non-Charter leave applications filed and ten appeals heard, meaning a ratio of 2.1 leave applications per appeal. On the other end of the spectrum? Civil procedure cases, with a ratio of 40 leave applications per appeal (80 leave applications made, and only two appeals heard). Torts (5.3:1), contract law (10.5:1), and non-criminal Charter cases (13:1) round out the middle. (I have left criminal law cases out of the analysis, because the relatively high number of appeals heard as of right complicates the analysis. In addition, the calculation cannot be done for all categories of law, because the Year in Review groups smaller categories into a general “Other” category.)
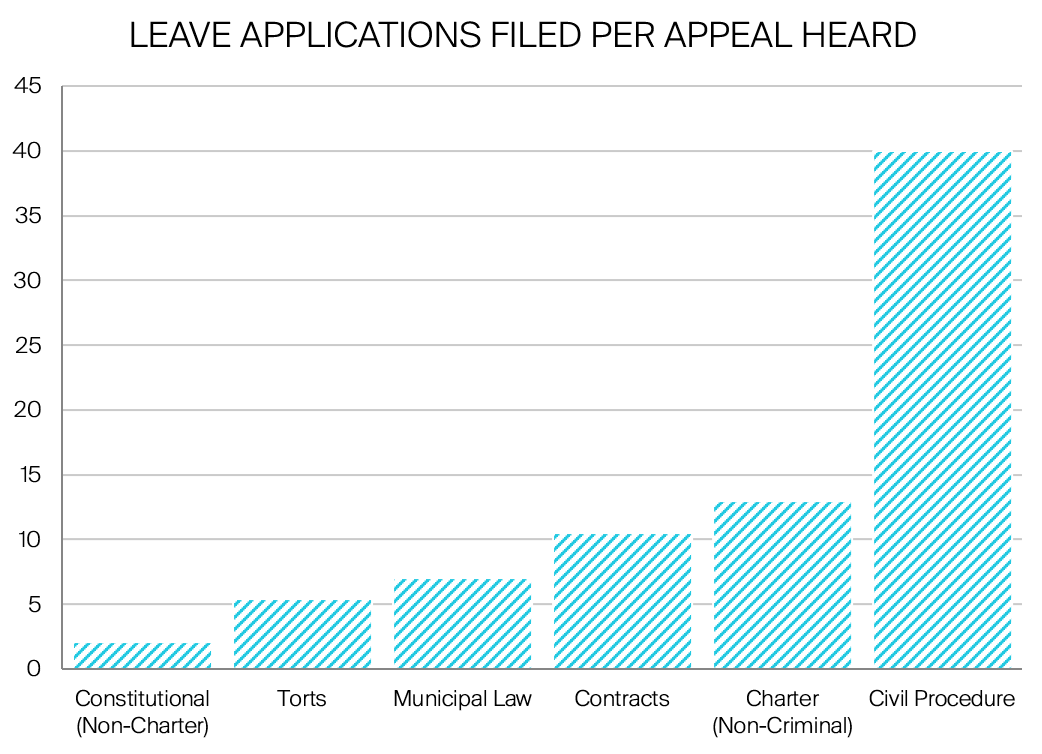
Some practitioners may be surprised by the relatively high ratio of leave applications per Charter (non-criminal) appeal, which seems to indicate that it is relatively difficult to get leave in a non-criminal Charter case compared to certain kinds of civil cases. This may be surprising, given the relative preponderance of constitutional cases heard by the Court. Two points are worth keeping in mind. First, the Court breaks out constitutional cases into three categories: Charter (criminal), Charter (non-Criminal), and other constitutional. Second, the high ratio is reflective of the fact that a larger number of Charter (non-criminal) leave applications are filed. In 2019, cases classified as Charter (non-criminal) represented the third largest category of leave applications with 39, after only criminal law and civil procedure being higher. This suggests while Charter cases continue to play a significant role in the Court’s jurisprudence, there are a much larger number of lower court cases that the Supreme Court does not believe raise novel issues of national importance.
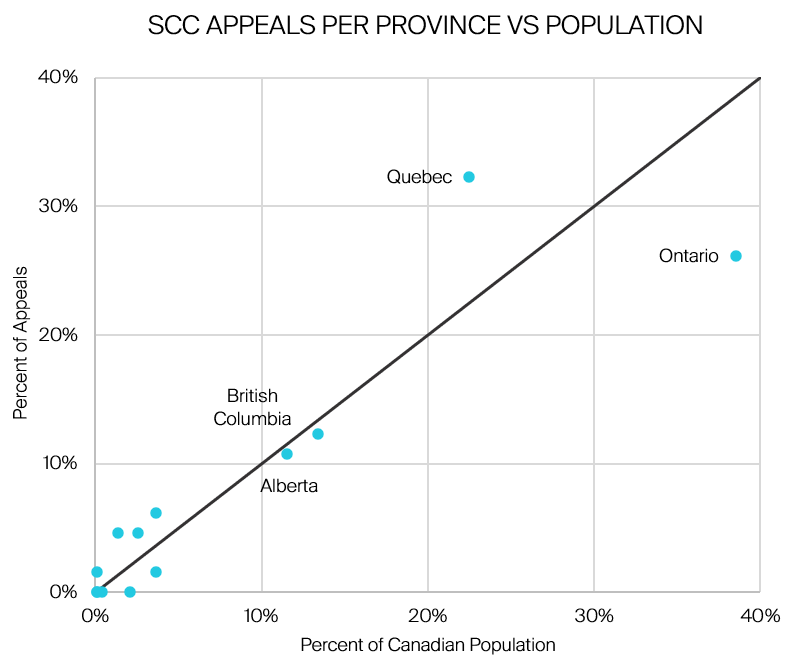
5. But they don’t vary (too much) by geography—Geography does not seem to play a significant role in deciding what cases come before the country’s highest Court, with a minor exception for Canada’s largest provinces.
The first graph below shows the percentage of leave applications in 2019 from each province in relation to its percentage of the Canadian population, while the second graph below compares the percentage of appeals heard in 2019 from each province in relation to its percentage of Canadian population. In each case, leave applications or appeals from the Federal Court of Appeal have been removed. The solid line shows the line where a province would have a proportion of leave applications or appeals exactly equal to its proportion of the population. Provinces above the line have more than their population’s fair share of cases, while provinces below the line have less than their population’s fair share of cases.
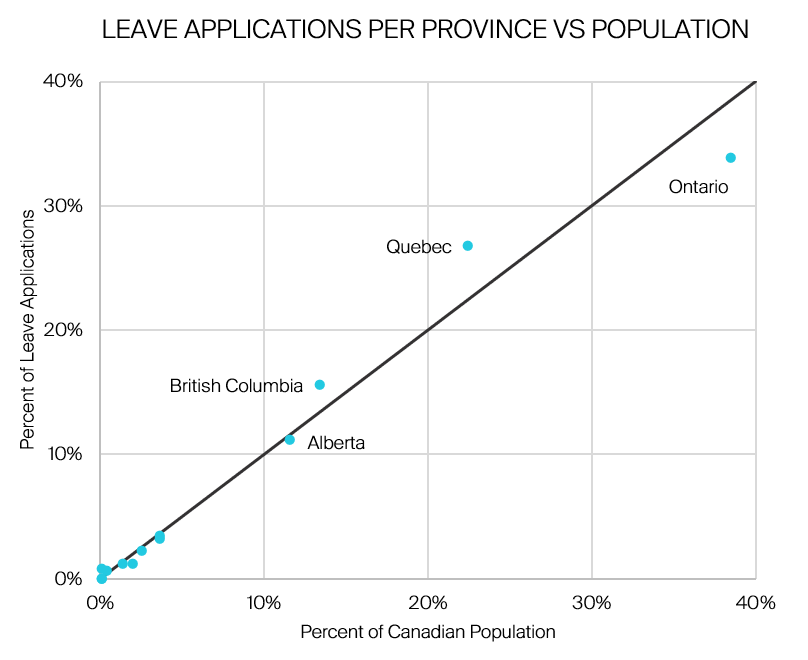
As these graphs show, the percentage of leave applications by province is highly correlated to their percentage of the population, as one would expect. Quebec feeds in slightly more leave applications than its population would suggest, and Ontario feeds in slightly less, but the differences are minor.
When it comes to appeals, the correlation remains present, though both Quebec and Ontario have moved further away from the line compared to the first graph. That means that their differences in numbers of appeals compared to their population are more pronounced. Quebec has roughly a ten percentage point greater share of appeals than its population would warrant (32.3% of appeals vs 22.5% of the population), while Ontario has a roughly 12 percentage point lower share of appeals than its population would warrant (26.2% of appeals vs 38.5% of the population). However, this analysis just reflects a single year of results, and one wouldn’t want to draw any firm conclusions from just a single year.
6. If you do get leave, the outcome is basically a coin toss—The Supreme Court of Canada is not intended to be a court of error correction; rather, it’s a Court that addresses issues of national importance. Given that, leave being granted shouldn’t be a signal that the Court believed the lower court decision was wrong, but rather a signal that the Court thought there was an important issue to address. The data bears that out.
Of those appeals decided in 2019, the Court allowed the appeal in 54% of cases and dismissed it in 46% cases. This percentage is slightly higher than the rate of appeals being allowed over the previous nine years, which ranged between 31% and 52%, suggesting a minor advantage to respondents. However, the overall advantage to respondents is minor, and last year’s difference from the recent historical average is also minor. In short, if your case has been granted leave, the outcome is a coin toss.
7. Be prepared for a decision from the bench—While the Supreme Court still takes time to consider cases and write reasons in most cases, the number of cases decided from the bench on the day of the appeal has skyrocketed in recent years.
In 2019, 35% of decisions were released from the bench on the same day they were heard. This number has been trending upward over time. From 2010-2013, no more than 12% of appeals in any year were decided from the bench. From 2014 through 2017, that number increased, floating between 22% and 29% in each year. In 2018, it hit 31% rising to 35% in 2019.
This trend raises interesting questions about the Court’s institutional role. Perhaps this trend signals that the Court is shifting in conceiving of itself as a Court that exclusively decides questions of national importance, to instead deciding some cases of national importance and some basic error correction cases. The absence of reasons might be justifiable in a case involving error correction, but it seems harder to justify if the case truly raises issues of national importance.
8. You’re more likely than not to have a dissent—An increasing trend in recent years is the number of cases featuring a dissent: in 2019, 58% of appeals decided were not unanimous as to the outcome. 2019 was trailed relatively closely by 2018, where 52% of cases had a dissent, and 2017, where 46% of cases had a dissent. Compare that to the beginning of the decade: in both 2010 and 2011, only 25% of decisions had a dissent. Put differently, the percentage of cases with dissents has doubled over the last decade.
While one might be tempted to think that this is a feature of the change from the McLachlin Court to the Wagner Court, the trend for more dissents actually started before that. Chief Justice McLachlin retired in December 2017. Yet there was a noticeable increase in dissent rates starting in 2016: after dissent rates between 21% and 32% for years between 2010 and 2015, the rate jumped to 39% in 2016 and 46% in 2017. Certainly, the trend has continued under Chief Justice Wagner, but it started before his appointment as Chief Justice.
9. If the Court reserves, you’re very likely to have a dissent—The two prior points combine into a further insight: if the Court reserves its decision, you’re extremely likely to have a dissent.
In 2019, the Court reserved its decision in 47 cases. In the same year, there was a non-unanimous outcome in 42 cases. If every single one of those non-unanimous outcomes occurred in a case in which the Court reserved, that would mean that almost 90% of cases in which the Court reserved have dissents.
Of course, not every non-unanimous outcome occurred in a case in which the Court reserved: the trend in increasing numbers of cases being decided from the bench has been accompanied by a handful of dissents in decisions delivered from the bench. A more granular dataset would be needed to accurately quantify the rate of the dissents in decisions in which the Court reserved. Yet the data above suggests that the vast majority of decisions in which the Court reserved featured dissenting judgments.
10. Expect about a year and a half from the leave application being filed till you have a decision on your appeal—In 2019, the average timelines in a Supreme Court appeal were: 4.0 months from filing the leave application until the decision in the leave application; 7.7 months from the granting of leave until a hearing; and 5.6 months between the hearing of the appeal and the judgment. Altogether, that means a party facing the prospect of a leave application can expect, on average, a process of 18 months if leave is granted. These lengths are roughly in line with the recent historical average, which has varied between 15.8 months and 19.7 months over the past ten years.