
Early Insights from the Supreme Court of Canada Decisions Project
In February 2022, we launched our Supreme Court of Canada Decisions Project. The core of that project is a publicly available database that contains detailed information about every Supreme Court of Canada decision going back to the mid-1950s. Anyone interested in analyzing the data for themselves can download a copy of our database and the coding manual at supremecourtdatabase.com.
Over the next several months, we will be doing a series of blog posts setting out some insights that we have gleaned from that data. We begin that series today with data about long-term historical trends at the Supreme Court of Canada.
We first begin with some basic data about the number of appeals at the Supreme Court over the last 60 years.
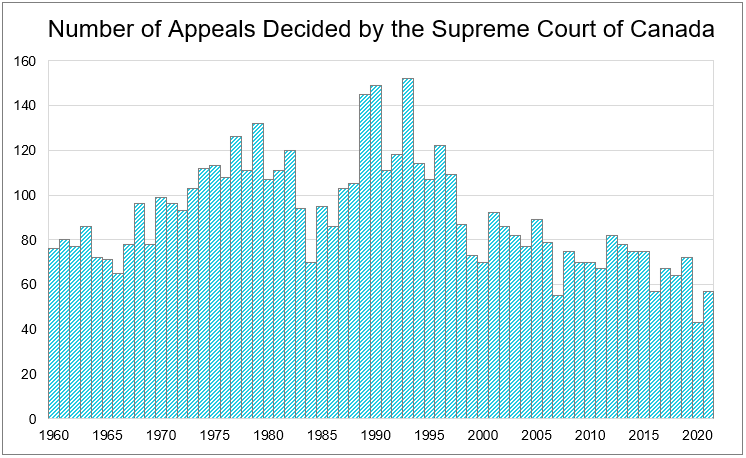
As this graph shows, the number of appeals heard by the Court annually has been declining over the last 30 years. In the high watermark period of the 1990s, the Supreme Court was routinely hearing more than 100 appeals a year. By contrast, in recent years, the Court is typically deciding less than 70 appeals per year.
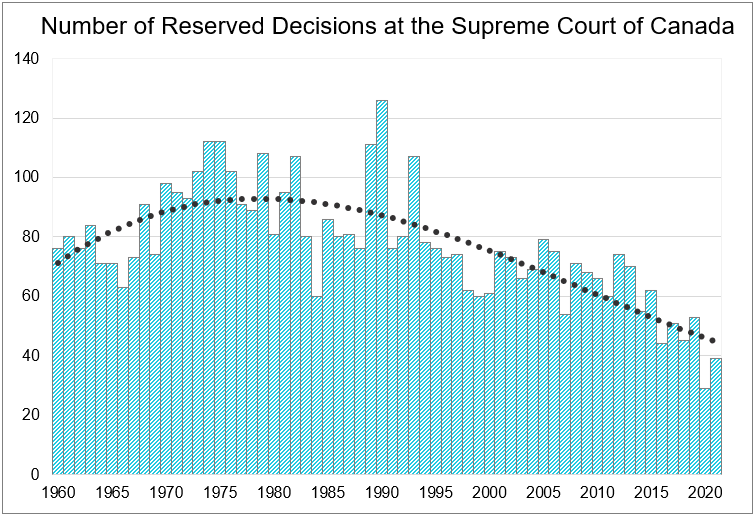
Another trend in recent years has been the rise of decisions from the bench, decided without reasons. One of the authors of this blog post is a co-author of a forthcoming article on the topic of decisions from the bench, so this blog post will not do a deep dive into that phenomenon. However, as the graph below shows, the combination of fewer appeals overall and more decisions from the bench means that there has been a relatively steady downward trend in the number of reserved decisions of the Court released with fulsome reasons.
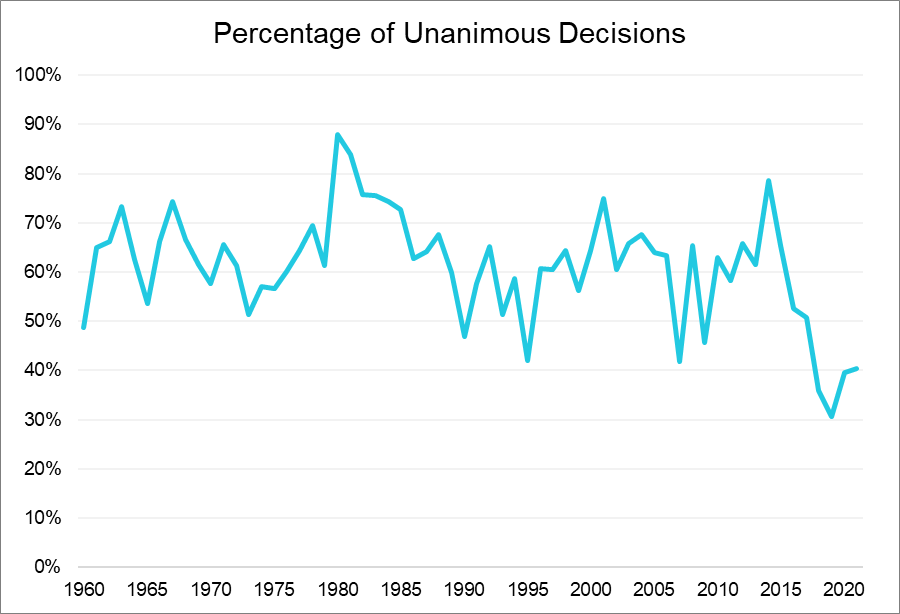
While the Supreme Court is deciding fewer cases per year, there is more controversy among the cases they do decide. The graph below shows the evolution of unanimous decisions over time—by unanimous in this context, we mean a case in which there is a single decision to which all judges sign on (that is, no dissents or concurrences). As that graph shows, over most of the Supreme Court’s history, the percentage of unanimous decisions has ranged between 50 and 70%. However, in several years, the percentage of unanimous decisions has dropped below 50%, and even below 40% in some years. Whether this is a blip or represents a new normal level of disagreement remains to be seen.
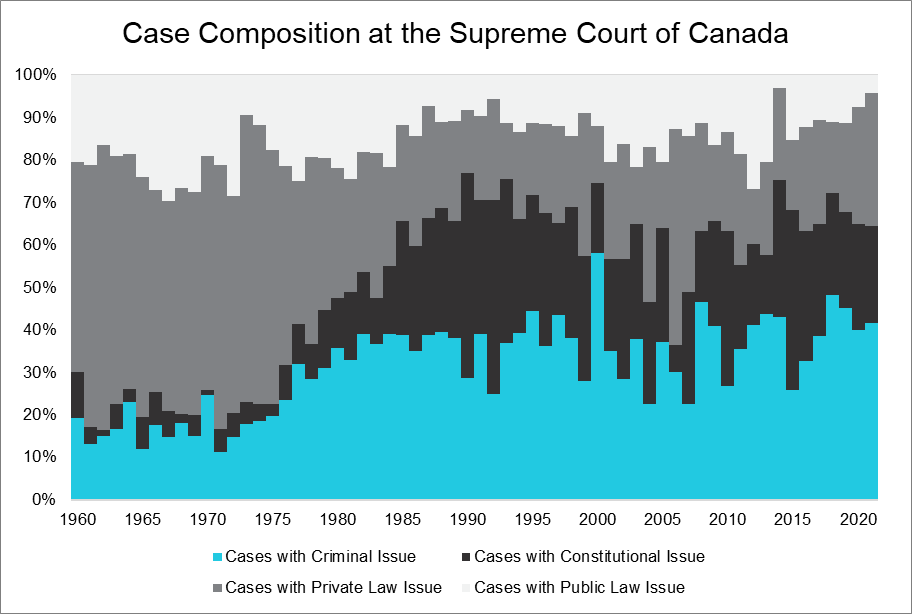
The composition of cases heard by the Court has also changed. As the graph below shows, in the 1960s, the bulk of the Court’s work was private law cases, with smaller shares of public non-constitutional cases and criminal law cases. However, the restriction of appeals as of right to criminal matters in the mid-1970s caused a relative swing in favour of criminal matters, while the advent of the Charter caused an explosion of constitutional issues. Now, private law cases typically take up less than 30% of the Court’s docket annually, with constitutional and criminal law matters now dominating.
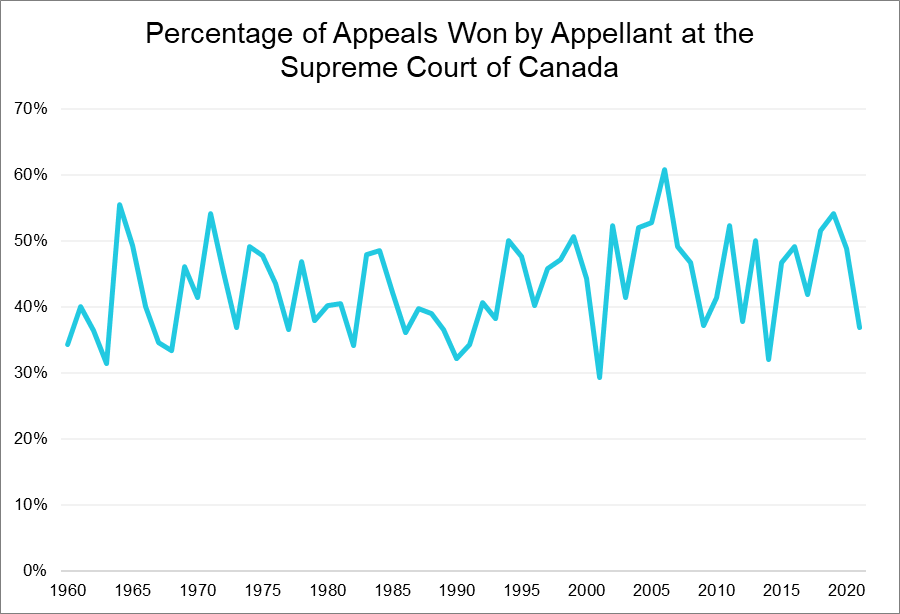
While many things have changed over the years, one thing that has remained relatively constant over time is the percentage of appeals won by the Appellant at the Supreme Court. In most years, the percentage of appeals won by the Appellant is between 40% and 50%, with no obvious trend over time. For comparison, this is higher than the percentage of appeals won by Appellants in at least some Courts of Appeal, which are sometimes estimated at around one-third, or even lower.
This data is just the tip of the iceberg as to what insights we can glean from the data in our database. Over the next several months, we will be doing more of a deep dive into what the data shows and how those insights can guide parties’ approach to appeals at the Supreme Court of Canada.